Equipment Explorer Features
Overview
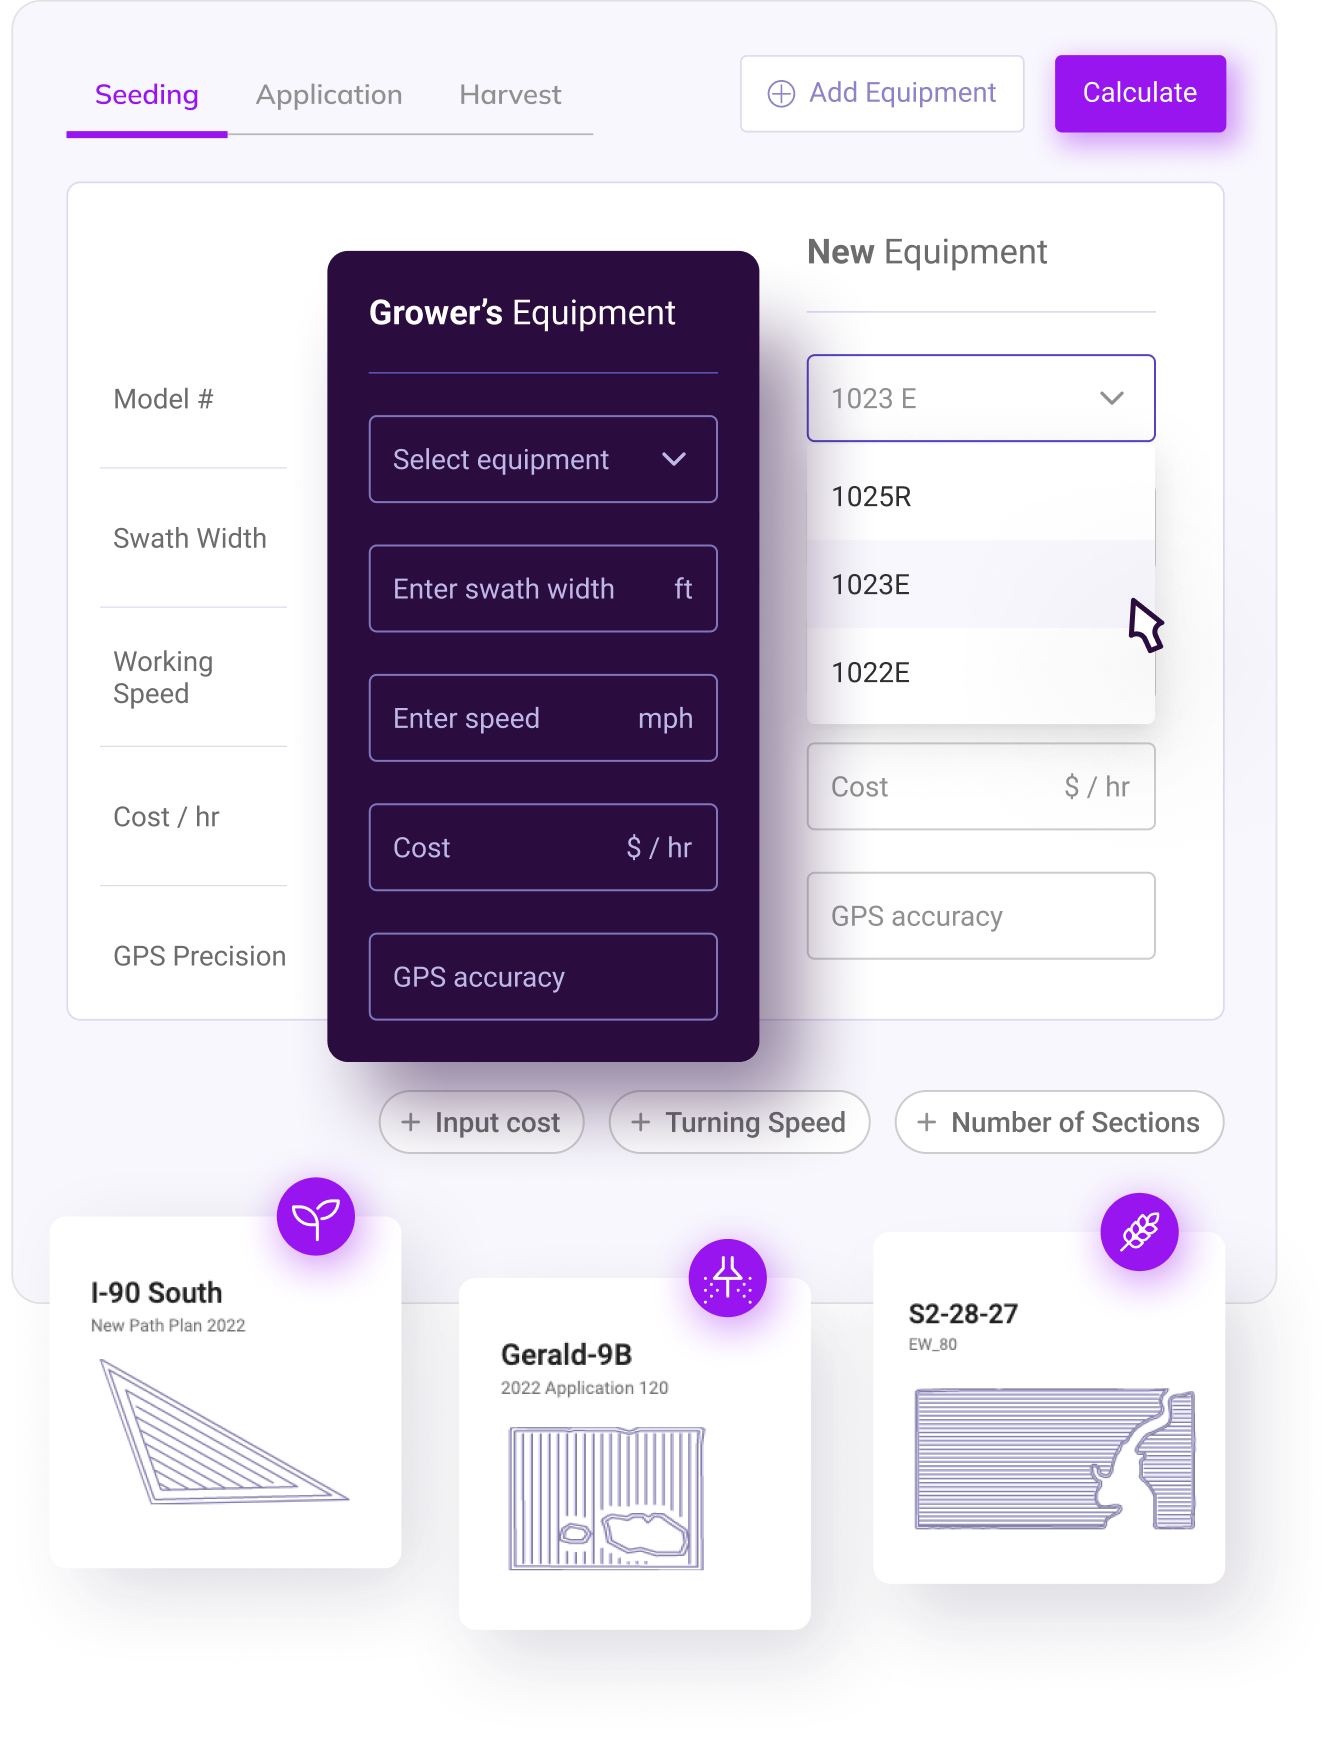
Equipment Explorer is a sales enablement tool that simulates equipment and technology performance on actual fields, helping dealers and growers make informed purchase decisions.
The Problem
Agricultural equipment dealers lack simple software to clearly illustrate the comparative value of machines, implements, or precision technology for specific farming operations. As equipment becomes more expensive and complex, dealers must showcase value on growers' actual fields during brief face-to-face interactions.
The Solution
Powered by the path planning engine, Equipment Explorer performs path planning for each field and aggregates insights across the entire farm. This enables users to optimize fleet composition by matching equipment size and functionality to operational scope and complexity.
Different sizes, widths, and speeds
GPS accuracy and section control
Cover more acres or reduce lineup
Field Boundary Capture
Quickly capture grower field boundaries to enable equipment performance simulation on actual farm layouts.
Worldwide Selectable Boundaries
Global satellite imagery layer from third-party providers covers vast farmland worldwide. In covered areas, users can navigate to their operation and select numerous fields simultaneously.
Time Savings
Transforms field boundary collection from hours-long task to minutes. Select multiple fields with simple clicks on satellite imagery.


Alternative Import Methods
Import existing boundaries from John Deere, CNHi, and other platforms
Upload standard GIS shapefiles from farm management systems
Draw boundaries directly on satellite imagery
Equipment Comparison
Calculate effective field productivity based on actual field characteristics, not oversimplified theoretical estimates.
The Problem with Traditional Calculators
Current tools use oversimplified calculations based only on working width and speed to estimate theoretical productivity (acres/hectares per hour). These fail to account for field size, shape, and terrain variations.
Example: Traditional calculators give the same productivity estimate for small irregular fields with varied topography as for large square fields - even though actual performance differs significantly.
Effective Field Productivity
Equipment Explorer calculates effective productivity by path planning on actual fields, accounting for turning time, maneuvering, and site-specific inefficiencies. This provides realistic performance comparisons.
Width × Speed = acres/hour
Path planning + turns + field shape
Example Use Cases
- Compare different combine harvester cutter bar widths
- Evaluate high-speed planter vs traditional planter productivity
- Compare different sprayer boom widths
- Assess productivity gains from equipment upgrades
- Optimize fleet composition for farm size and complexity


GPS Accuracy Analysis
Quantify the economic impact of GPS accuracy upgrades by measuring reduced pass-to-pass overlap on actual fields.
The Historical Compromise
GPS guidance inaccuracy historically forced operators to decrease track spacing below implement width, ensuring slight overlap to avoid untreated gaps. This introduced inefficiencies:
- Increased working distance and time
- Product overapplication and higher input costs
- Potential yield reductions from over-application
While more accurate GPS systems are now affordable, many farms still use sub-RTK signals. Dealers struggle to demonstrate upgrade value in the context of specific operations.
Overlap Analysis
Equipment Explorer evaluates different GPS accuracy levels and their impact on intentional pass-to-pass overlap. It differentiates between:
Necessary overlap at headlands and field edges
Intentional overlap between parallel passes due to GPS inaccuracy
Economic Justification
Quantifies additional costs from pass-to-pass overlap:
By presenting these figures on grower's actual fields, Equipment Explorer makes the economic argument for GPS upgrades clear and compelling.
| Grower's Equipment | New Equipment | |
|---|---|---|
| Planned Overlap Area | 70.60 ha | 11.43 ha |
| Coverage overlap | 24.66 ha | 2.75 ha |
| Pass to pass overlap | 45.94 ha | 8.68 ha |
| Visualization |

|

|
Grower's Equipment
Visualization
New Equipment
Visualization
Section Control Analysis
Compare section control implementations to demonstrate overlap reduction and recommend optimal section width for specific fields.
Section Control Evolution
Section control technology has evolved from simple 2-section systems to advanced individual nozzle/row control, offering significant reductions in input overlap and waste.
The Challenge
Higher precision (individual nozzle control) costs more than broader sections (3-meter sections). Ideal section width depends heavily on field geometry and complexity.
Dealers struggle to demonstrate section control value tailored to individual farming operations and recommend the most cost-effective section width.
Overlap Reduction Analysis
Equipment Explorer compares different section control levels, illustrating reductions in unintentional overlap that lead to:
- Product waste reduction
- Input cost savings
- Yield loss prevention from over-application
Field-Specific Recommendations
By analyzing actual field geometry, Equipment Explorer helps growers make informed decisions on appropriate section control technology for their specific operation.
| Grower's Equipment | New Equipment | |
|---|---|---|
| Planned Overlap Area | 70.60 ha | 11.43 ha |
| Coverage overlap | 24.66 ha | 2.75 ha |
| Pass to pass overlap | 45.94 ha | 8.68 ha |
| Visualization |

|

|
Grower's Equipment
Visualization
New Equipment
Visualization
Platform Value
Equipment Explorer creates value for OEMs, dealers, and growers while generating high-quality data for AI training and autonomous systems.
OEM Benefits
-
Increased Equipment Sales
Dealers close more deals with data-driven value demonstration
-
Digital Engagement
Dealers upload boundaries and create grower organizations on OEM platforms
-
Recurring Revenue
Growers adopt Path Planner, creating software subscription opportunities
Dealer Benefits
-
Competitive Advantage
Demonstrate value on grower's actual fields, not generic estimates
-
Sales Enablement
Powerful tool for face-to-face grower interactions
-
Grower Data Capture
Enrich grower data repository and increase digital engagement
Data Value for Autonomy
Equipment comparisons generate grower operational decisions that form rich datasets for AI training. These plans reflect current operational strategies and accelerate the transition to autonomous farming.
OEM → Dealer → Grower Flywheel
Dealers use Equipment Explorer to win sales → Growers adopt Path Planner for new equipment → Path plans create training data for autonomous systems → OEMs gain AI training data and recurring revenue